May 6, 2022
What are the Odds?
If you are a sports fan like me, you may be familiar with ESPN’s Win Probability graphic. It is displayed on the ESPN website as games unfold. Their model tracks and updates the odds that one team will win based on the circumstances of the game in real-time.
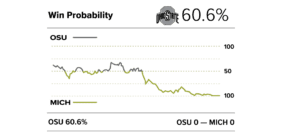
As an example of how it works, when Michigan played Ohio State in football in November, the model:
- Gave the Buckeyes a 60.6% chance to beat the Wolverines when the game began,
- Had the Buckeyes as a 54.6% favorite at halftime, even as the Wolverines led 14-13,
- Put the Wolverines at 90.3% odds to win at the end of the 3rd quarter, with the score 28-13.
- Stayed above 95% for the last 10 minutes of the game as Michigan held an 8-to-15 point lead.
This type of analysis, which uses real-time data to forecast the probability of a binary event (win/loss) is similar to the way we use economic and market data to forecast the probability of a recession occurring in a given timeframe, which is also binary (yes/no).
In early April, the 2-year / 10-year segments of the yield curve inverted. The financial market media treated the event more like a light switch being flipped, communicating ‘the yield curve inverted, so a recession is coming.’
This article will provide a more sophisticated way of looking at the yield curve and a way to think probabilistically (0-100% odds) rather than a binarily (inversion = recession) about the business cycle signals being sent by the yield curve.
Where to Focus on the Yield Curve
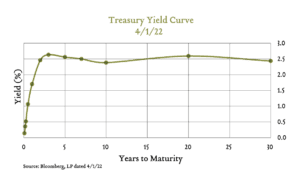
The yield curve has historically been a significant reliable leading indicator of recession risk. The yield curve has inverted prior to each of the last eight recessions. On April 1, 2022, the 2-year/10-year portion of the yield curve inverted for the first time since 2019.
Astute readers of our monthly materials will note that we do not typically focus on the 2s/10s. We normally present on the 3-month/10-year spread when discussing the yield curve. In this article, however, we are going to present three places to look on the yield curve when assessing recession risks.
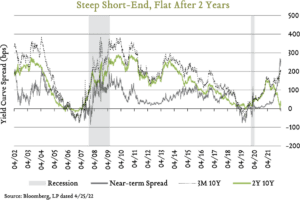
#1 – The near-term yield curve spread (3 months vs. 18 months forward):
The near-term forward yield spread is Federal Reserve Chair Jay Powell’s favorite yield curve indicator. It can be interpreted as the market’s expectations for the near-term trajectory of Fed policy rates. If we were stuck on a desert island with just one yield curve indicator, we would take the near-term spread.
It is currently not inverted, not flat, but actually steeper than it has been in over 20 years. In a moment, we will show the implied recession probability of such a steep reading.
#2 – The 3-month / 10-year spread:
Our next favorite, and the one we show in our update materials, is the 3-month / 10-year spread. This spread is also relatively steep at the moment, over 200bps.
#3 – The 2-year / 10-year spread:
This is the spread that inverted in April. It remains relatively flat, but is currently back to a positive slope of roughly 20 basis points or so.
It is unusual to observe such a divergence between the three indicators, but the market is pricing in some relatively unusual Fed policy expectations.
Converting Yield Spreads into Recession Probabilities
We use models for many economic and market indicators to convert observed values into 12-month recession probabilities based on historical observations.
This is akin to the Win Probability calculator. At half time, with Michigan leading 14-13, what are the odds they will win the game?
It’s April, 2022. The 2s/10s inverted. What is the probability of recession in the next 12 months? Let’s look at the sigmoid curves.
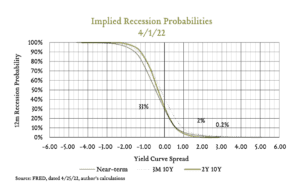
The 2s/10s implied a 1/3rd chance of recession in the next 12 months as of April 1. Other spreads implied almost no chance of recession at all.
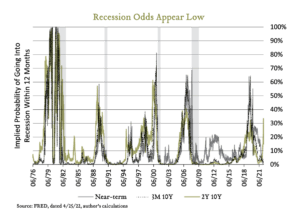
Overall, we believe recession risks remain quite low over the coming 12 months. The yield curve is no longer inverted and 2s/10s are back down to a 15% implied probability of recession.
Conclusion
What message is the yield curve sending? In our opinion, the steep short-end, and flat longer-end portions of the curve indicate the following:
- The market expects significant Fed policy rate hikes over the next 18 months, and
- Beyond 2024, if the Fed hikes as expected, recession risks rise significantly.
Other leading indicators of recession, including the labor market, corporate earnings, and retail sales activity, continue to indicate a low probability of recession over the coming 12 months. As a result, we are positioning portfolios for continued expansion. Ultimately, we know it is when, not if, we will experience another recession. We strive to assess the risks and construct portfolios that will help our clients achieve their financial objectives in all economic environments. Thank you for the opportunity to serve on your behalf. If you have any questions about this information, please reach out to a member of your client centric team.