March 26, 2019
The Yield Curve Inverted…What Now?
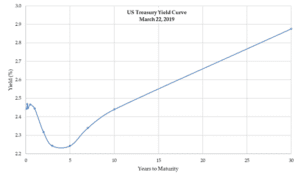
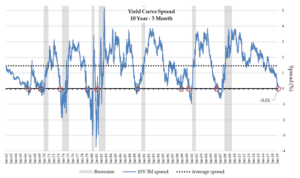
On Friday last week, the U.S. treasury yield curve inverted. Weak economic data out of Europe spurred heavy demand for bonds, pressuring the 10-year yield to 2.44%, its lowest level in over a year and about a basis point lower than the 3-month T-bill yield. This is significant because a curve inversion is considered one of the more reliable indicators of an impending recession. The U.S. is late in its business cycle and near-term recession risks are increasing. Below, we offer some perspective on what an inverted yield curve, and inevitably a recession, can mean for your portfolio.

It is typical for the yield curve to be upward-sloping; longer-term bonds normally offer higher yields than shorter-term bonds to compensate for higher volatility and risk. During an inversion, longer-term yields fall below shorter-term yields. This reflects investors’ expectation that central bankers may need to lower short-term yields in response to slowing economic growth. Yield curve inversions have been a fairly reliable indicator of recession risk, occurring 4-24 months prior to each of the last seven recessions. There have also been two inversions that were not followed by a recession.

We have been anticipating a yield curve inversion, but our expectation was that it would occur in late 2019 or early 2020. The flattening of the yield curve accelerated as recent economic data have been disappointing and the Federal Reserve reacted by adjusting forward guidance to be more accommodative. So far, the stock market response has been somewhat muted. The S&P 500 declined 1.9% on Friday, ending the week down 0.8% overall.
Looking forward, we see a few different potential directions for the U.S. economy.
- Economic fundamentals could improve. Lower interest rates benefit certain sectors of the economy like housing. If growth prospects improve, it could be positive for stocks and negative for bonds, which currently price in lower growth expectations;
- Fundamentals could deteriorate further. If this occurs, we would increase our assessment of the probability of recession. If the economy goes into recession, we would expect the Federal Reserve to respond with rate cuts. This scenario could be negative for stocks and positive for bonds;
- This inversion could be different. We acknowledge that historically-reliable indicators may not be valid out-of-sample. A more globally-integrated economy may react differently. Central bankers are deploying new tools to fulfill their objectives. We will continue to analyze a variety of economic data, not solely historical indicators like the yield curve, to set our expectations for the future.
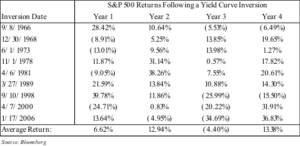
Regardless of how the narrative shapes up, a disciplined long-term focus will serve investors well. On average, the market experience (as measured by S&P 500 returns) has been positive in periods immediately following yield curve inversions. Examining periods following the last nine yield curve inversions, we see that more often than not, returns have been positive in the two years that follow.

Using history as a guide, the yield curve is telling us to expect a recession in the next couple of years. We are late in what is likely to become the longest economic expansion in U.S. history and the eventual onset of a recession was always inevitable. We caution investors not to use more recent recessions (tech bubble, great recession) as a proxy for a normal experience. A typical recession involves a 2.0%–2.5% contraction in GDP over the course of a year with fairly quick recovery from short-term weakness in the market. Maintaining discipline during periods of economic uncertainty and market volatility is the most reliable course for growing and preserving wealth.
We will continue to monitor and evaluate the dynamics playing out in the economy. As the situation unfolds, we will be here to respond and communicate our views. Please contact any member of our team if you have questions.
