December 9, 2022
Revisiting Monte Carlo Analysis after a Challenging Year
Following extremely robust market returns in 2021, and new all-time highs the first week of this year, 2022 has proven to be a challenging year for investors to date. While up from its mid-October lows, the S&P 500 index registered an intra-year drawdown of approximately 25%, while the aggregate bond market didn’t fare much better registering its own 18% intra-year drawdown. This means that a traditional 60/40 portfolio without alternative assets would have been down about 22% during the depths of the declines in mid-October. Confounding the poor returns is the highest levels of inflation since the 1980’s, with price increases in energy and food leading the way. Many people have been left wondering about the best way to do a financial wellbeing check-up.
A powerful planning tool we utilize at Greenleaf Trust is Monte Carlo analysis. The analysis is highly customized to each client’s financial life, incorporating their income, spending, financial accounts, asset allocation, and portfolio contributions. As a holistic wealth management firm, the more details that our clients share with us, the better we can plan and the more informed we can make our recommendations. The analysis employs Monte Carlo simulations, which enable us to more clearly understand the potential outcomes associated with a client’s plan. Monte Carlo simulations use a randomized selection of historical returns to test the projected cash flows and return a probability of meeting goals. Monte Carlo simulations employ thousands of potential future return paths to allow us to answer several popular questions that investors are having today: 1) how can we plan for higher inflation in the future, 2) how will changing my asset allocation impact my portfolio, and 3) am I still on track to reach my long-term financial goals.
How can we plan for higher inflation in the future?
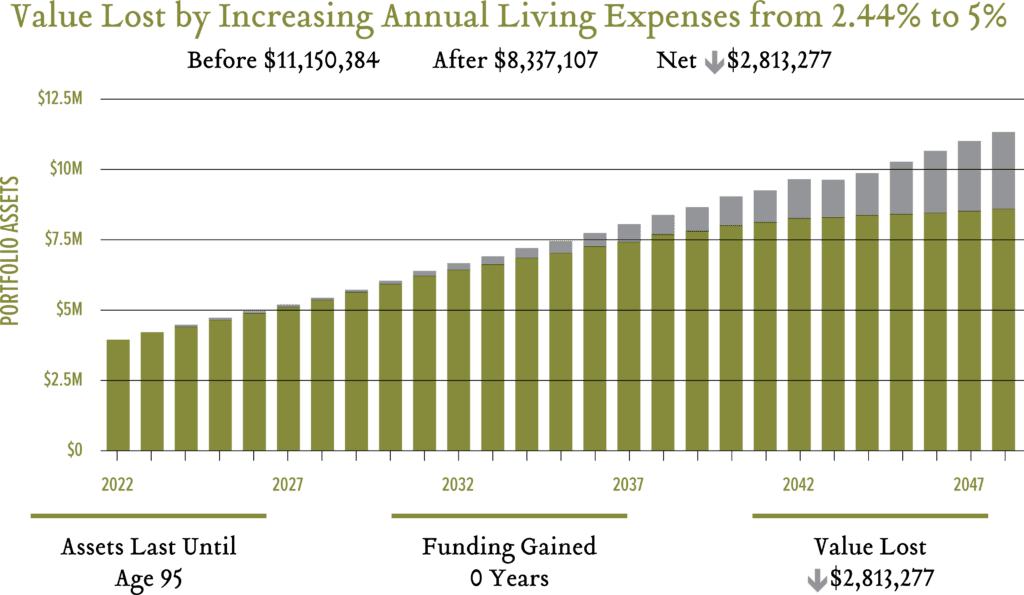
Year-over-year consumer price index (CPI) numbers, which are a measure of inflation, were reported as high as 9.1% earlier this year. Higher costs have forced people to make adjustments in their budgets and how they choose to allocate funds. One way to demonstrate the impact that higher costs of living have on a portfolio is through adjusting the annual growth rate for a client’s living expenses in our planning tool. The default option is to use a long-term CPI figure of 2.44% annually. This means that if a client’s living expenses are $100,000 in 2022, it will jump to $102,440 in 2023, followed by $104,940 in 2024. We have the ability to change the living expense growth rate to an exact inflation number that a client would like to see. If a client wants to know if they can sustain a 5% annual cost of living increase over their lifetime, we can run that exact scenario and discuss the impact that it has on the portfolio. As shown below in this hypothetical scenario, we can demonstrate the total value lost from increasing living expenses to 5% annually, rather than 2.44%, over the next 26 years.
How will changing my asset location impact my portfolio?
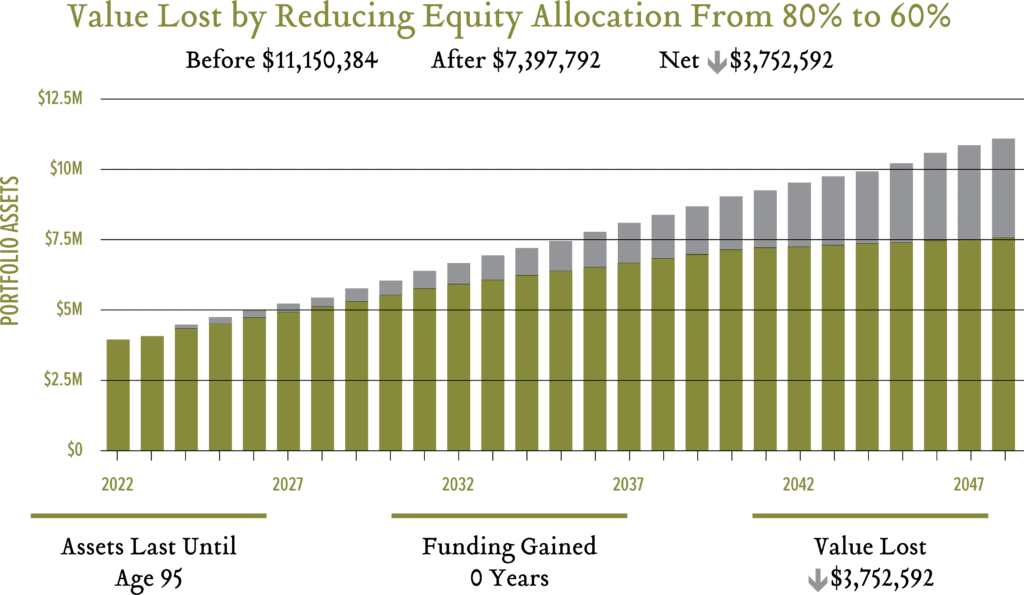
With such a volatile year, many clients have considered reducing their equity allocation and allocating more funds to cash to reduce volatility. While we usually disagree with making emotionally reactive asset allocation changes, we have the data to back up our rationale. We have the ability to change asset allocation within the analysis and show the long-term implications of the decision. As seen below, in the hypothetical scenario, we can demonstrate the total value lost over their lifetime by reducing a client’s equity allocation from 80% to 60%.
Am I still on track to reach my long-term financial goals?
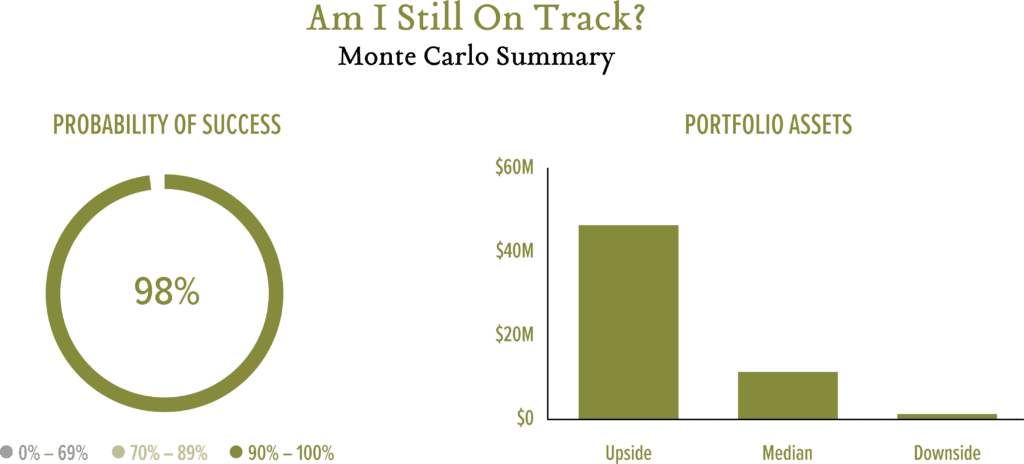
Many of our clients invest with a purpose and with goals in mind. These goals help shape our decision making on asset allocation and investment management. Goals can be as broad as having enough money to enjoy a comfortable retirement, or as specific as funding a grandchild’s education at Western Michigan University beginning in 2028. Whatever the goal is in mind, the Monte Carlo analysis incorporates volatility into investment returns and shows a range of possible outcomes. The analysis typically runs thousands of trials and gives a variety of forward looking outcomes, ranging from the upside (one of the best market outcomes), median (middle-of-the-road market outcome), or downside (one of the worst market outcomes). It also shows the probability of success, which represents how likely your plan is to succeed. We aim for at least a 90% probability of success, due to the uncertainty of future market outcomes.
Summary
These are just a few scenarios to demonstrate the capabilities of the Monte Carlo analysis. There are dozens of “what-if” scenarios that we run for our clients every day. As the needs of our clients continue to evolve, we invest in the proper tools to ensure we can make educated and informed recommendations that are aligned with our clients’ long-term goals.